
Gold vs DXY: Why the Dollar Often Moves Against Gold
Why gold and the US Dollar Index often move in opposite directions, what DXY really measures, when the link breaks and how to test it yourself.
By Volodymyr Kravchenko Published Updated Data as of

Short answer
Gold and the US Dollar Index (DXY) often move in opposite directions because gold is priced in dollars and the World Gold Council counts a weaker dollar as lowering gold's opportunity cost. The link is a tendency, not a rule. DXY is 57.6% euro, and in the WGC's own H1 2026 attribution the dollar explained only a part of gold's variability.
Key takeaways
- Gold is priced in dollars, so a stronger dollar makes it dearer for holders of other currencies; the WGC describes a weaker dollar as making gold more attractive.
- DXY is a six-currency index and 57.6% euro, so 'gold vs DXY' is largely 'gold vs EUR/USD'.
- The inverse link can break, for example when risk demand lifts gold and the dollar together.
- Test the link on daily changes over your own window, and compare DXY with the Fed's broader dollar index.
On this page 7 sections
Two reasons the link exists
Pricing currency. Gold is quoted in US dollars. When the dollar strengthens against other currencies, gold becomes more expensive for people who hold those currencies, which can weigh on demand. This is a mechanism of the market, and it explains why the relationship is a tendency.
Opportunity cost. The World Gold Council says gold becomes more attractive as bond yields fall or currencies, especially the US dollar, depreciate, and vice versa. Gold pays no interest, so a stronger dollar, which often accompanies higher US yields, tends to raise the cost of holding it. See gold and real yields for the yield side.
What DXY is, and what it is not
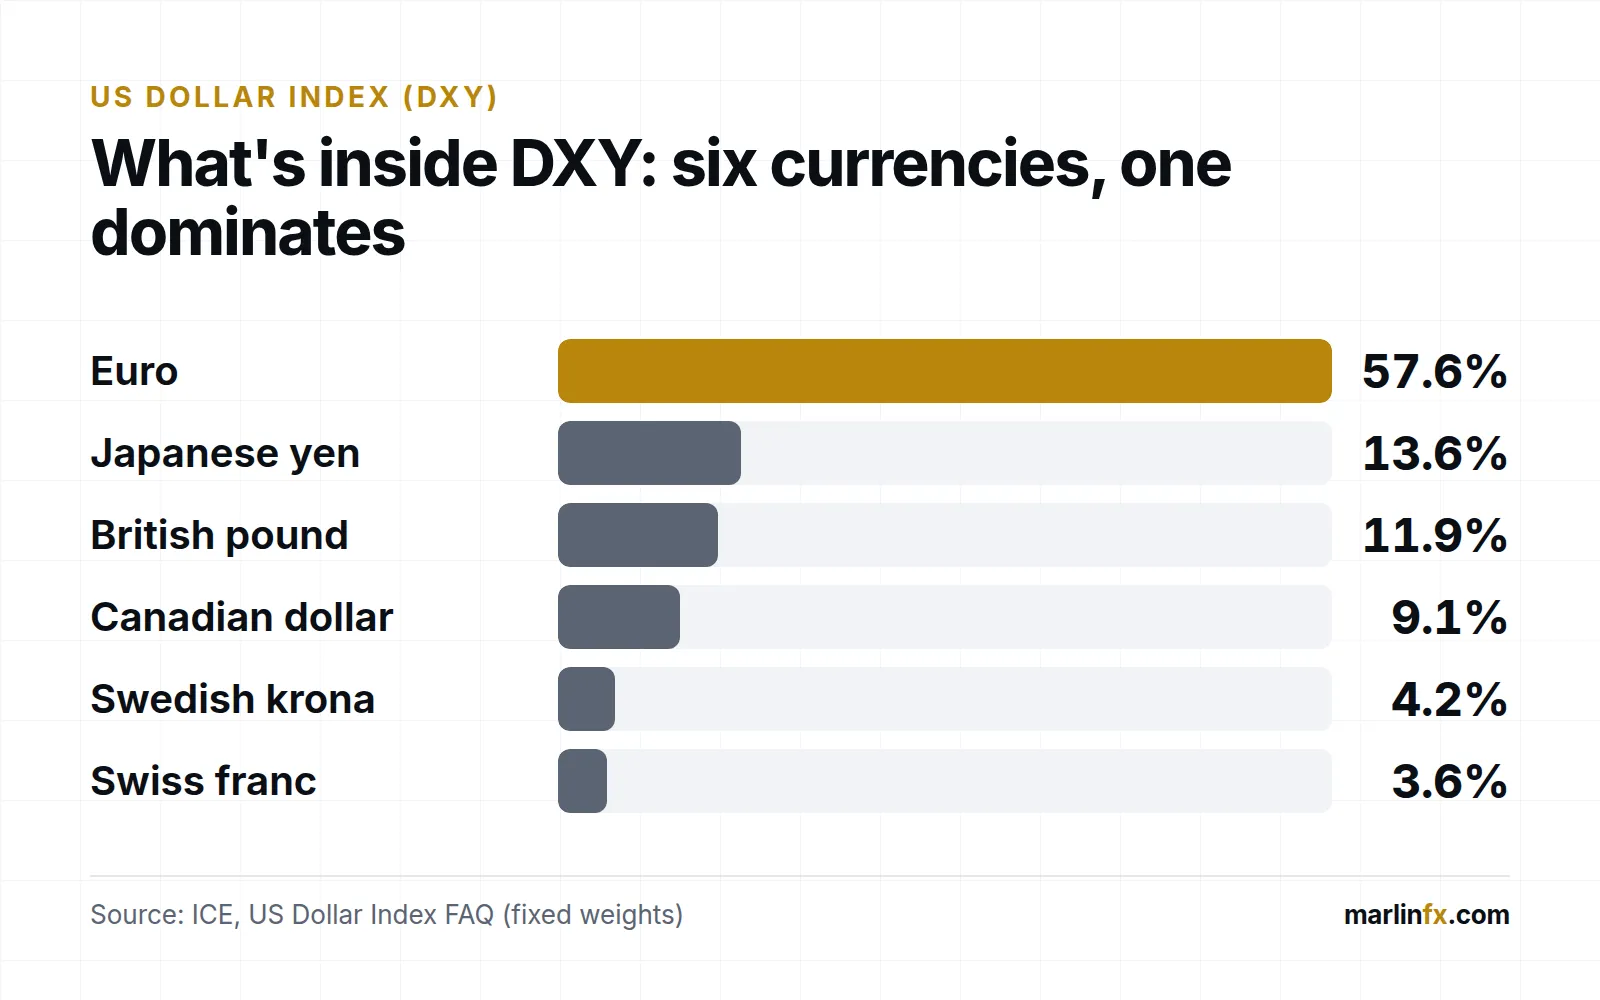
DXY’s fixed currency weights (source: ICE). The euro alone is more than half the index.
The US Dollar Index is published by ICE. It is a geometric average of six currencies against the dollar, measured relative to March 1973, with these weights:
| Currency | Weight |
|---|---|
| Euro | 57.6% |
| Japanese yen | 13.6% |
| British pound | 11.9% |
| Canadian dollar | 9.1% |
| Swedish krona | 4.2% |
| Swiss franc | 3.6% |
ICE states the index was adjusted once, when the euro was introduced, with no scheduled rebalancing since. Two consequences for gold traders, both analysis:
- With 57.6% in euros, “gold vs DXY” is in large part “gold vs EUR/USD”. Euro-specific news can move DXY even when the dollar is steady against everything else.
- Currencies outside the six, such as the Chinese yuan and Mexican peso, are not in DXY. The Fed’s broad dollar index uses a wider basket, and the two can diverge.
How much does the dollar explain?
In the WGC’s attribution for the first half of 2026, the dollar (FX) accounted for part of gold’s variability, with momentum and risk and uncertainty larger and a sizeable part outside the model (the figures are on the WGC’s page, not restated here). The dollar mattered, but it was not the whole story. For later periods check the WGC’s latest publication: VERIFY CURRENT DATA.
When the link weakens or breaks
- Risk events. Both gold and the dollar can be sought in stress, so they can rise together.
- Momentum. Trend-following flows can push gold in one direction regardless of the dollar.
- Euro-driven DXY moves. If DXY moves because of the euro alone, gold may not respond.
- Central-bank purchases, which the WGC’s model does not capture, can support gold independently.
A simple reading guide
| What you see | Consistent with the usual link? | What to check next |
|---|---|---|
| DXY up, gold down | Yes | Is the move driven by the euro or broad dollar strength? |
| DXY down, gold up | Yes | Are real yields also falling? |
| Both up | No | Risk demand, momentum or a central-bank buying story |
| DXY flat, gold moving | No | Yields, risk, momentum or news specific to gold |
This guide describes how the relationship has usually behaved. It is not a trading signal, and no row guarantees what happens next.
How to test it yourself
- Get daily closes for XAU/USD and DXY from your charting platform, for example TradingView.
- Convert both to daily percentage changes, not levels.
- Calculate the correlation over fixed windows, such as 60 and 250 trading days, in a spreadsheet.
- Repeat with the Fed’s broad dollar index (DTWEXBGS, free from FRED) to see whether the result depends on which dollar measure you use.
- Record the window and date, and expect the sign and strength to change between windows.
What could change this view
- A period in which the dollar explains far more, or far less, of gold’s variability than in H1 2026.
- A change in the mix of DXY-moving currencies, for example a large euro move that is unrelated to the wider dollar.
- A shift in risk sentiment that makes gold and the dollar move together.
For the bigger picture, read what moves gold prices and how to trade gold. This article is educational analysis, not personal advice, and leveraged trading carries a high risk of loss.
How this was prepared
Checked 20 Sep 2026
DXY composition is quoted from ICE's official FAQ; the opportunity-cost description and the H1 2026 attribution are from the World Gold Council. The reading guide and testing method are Marlin analysis. No index or price levels are quoted; use the live charts and official series linked below. Facts are separated from analysis and opinion; anything that could not be verified against a current source is marked VERIFY CURRENT DATA. Read the full methodology and editorial policy.
Sources (3)
ShowHide
Official or primary sources used for the facts above. Figures and terms change, so check the source before acting on them.
- ICE (Intercontinental Exchange) — U.S. Dollar Index Contracts — FAQDefines DXY: six currencies, their weights, the March 1973 reference and the single historical adjustment.Accessed
- World Gold Council — Gold Mid-Year Outlook 2026Opportunity-cost description and H1 2026 attribution; published 1 July 2026.Accessed
- Board of Governors of the Federal Reserve System (via FRED) — Nominal Broad U.S. Dollar Index (DTWEXBGS)A separate, broader trade-weighted dollar index for comparison with DXY.Accessed
Frequently asked questions
Why do gold and the dollar move in opposite directions?
Gold is priced in US dollars, so a stronger dollar makes it more expensive for holders of other currencies. The World Gold Council also describes gold as more attractive when the dollar depreciates. It is a common tendency, not a fixed rule.
Is the gold–DXY correlation reliable?
Not always. In the WGC's attribution for the first half of 2026 the dollar explained only a part of gold's variability, with momentum and risk and uncertainty larger. The relationship can weaken or reverse in some periods.
Is DXY a good measure of the dollar?
It is a quick gauge, but narrow: six currencies, with the euro at 57.6%. The Federal Reserve publishes a broader trade-weighted index that can tell a different story.
What happens when gold and DXY rise together?
In Marlin's analysis it usually suggests another driver, such as risk and uncertainty or momentum, is outweighing the usual inverse link. It is a cue to check the wider backdrop, not a signal.
AdAnalyze markets with the right tools
Advanced charts, indicators and market analysis tools to put this workflow into practice.
Explore TradingViewDisclosure: Some links on this website are affiliate links. If you use them, we may receive compensation at no additional cost to you. This does not determine our editorial analysis, reviews or comparisons.
Written by
Volodymyr KravchenkoIndependent market researcher focused on Forex, Gold, commodities, macroeconomic data and AI-powered financial intelligence.
- Forex, gold and oil market research
- Macroeconomic data analysis
- Search-data and SEO analysis
- Website and data-tool building
Educational research, not personal advice. See our editorial policy and methodology.
This content is provided for educational purposes only and is not investment advice. Trading involves risk, and past performance does not guarantee future results. Affiliate relationships may exist. Always conduct your own independent research before making financial decisions.
Related articles

Bitcoin and Gold Correlation in 2026: What It Means for Gold Traders
Bitcoin's 90-day correlation with gold rose above 0.5 in 2026 as its link to tech stocks weakened. What the numbers mean, their limits and how to check them.
Read analysis
Trading Gold with FxPro: Symbols, Hours, Costs and Sizing (2026)
How gold trading works at FxPro: GOLD, GOLDoz and weekend GOLD365, contract sizes, UTC hours, spread, commission and swap, with worked sizing examples.
Read analysis
Gold and Real Yields: Why Opportunity Cost Matters
Why rising real yields have often pressured gold, what a real yield is, why the link is unstable, and how to test it yourself with official data.
Read analysis