
Bitcoin and Gold Correlation in 2026: What It Means for Gold Traders
Bitcoin's 90-day correlation with gold rose above 0.5 in 2026 as its link to tech stocks weakened. What the numbers mean, their limits and how to check them.
By Volodymyr Kravchenko Published Updated Data as of

Short answer
In 2026 bitcoin has traded more like gold and less like tech stocks. Grayscale reported on 27 August 2026 that bitcoin's 90-day correlation with gold rose above 0.5, while its correlation with the Nasdaq-100 fell from above 0.6 to about 0.33. In April 2022 the picture was the reverse. A correlation near 0.5 is moderate, backward-looking and has been unstable, so it does not make bitcoin a substitute for gold or a signal for trading it.
Key takeaways
- Reported 90-day bitcoin–gold correlation rose from near zero at the start of 2026 to above 0.5 by late August (Grayscale); over the long run since 2010 it has been close to zero.
- A correlation of 0.5 means the two share only about a quarter of their day-to-day variation, and bitcoin moves much more, so it is not a like-for-like hedge.
- Check correlations on daily returns over a stated window; TradingView's built-in indicator uses price levels by default.
On this page 6 sections
What the numbers say
Fact. These are readings published by research firms and media, with the window each one used. They are snapshots, not one continuous series.
| Reported | vs gold | vs Nasdaq |
|---|---|---|
| 19 Apr 2022 · Arcane · 30-day | −0.45 | 0.70 |
| 27 Aug 2026 · Grayscale · 90-day | above 0.50 | ≈ 0.33 |
| 3 Sep 2026 · Bitwise · 90-day | 6-year high | not given |
| 26 Sep 2026 · Investing.com · 90-day | ≈ 0.50 | ≈ 0.30 |
- 2022 (Arcane Research, via Decrypt): −0.45 was an all-time low against gold; 0.70 was the highest against the Nasdaq since July 2020.
- 2026 (Grayscale, via Yahoo Finance): the gold reading rose from near zero in January; the Nasdaq-100 reading fell from above 0.60. Bitwise data cited by The Block also showed a negative 90-day correlation with the dollar index. The Investing.com figures come from a contributor analysis piece.
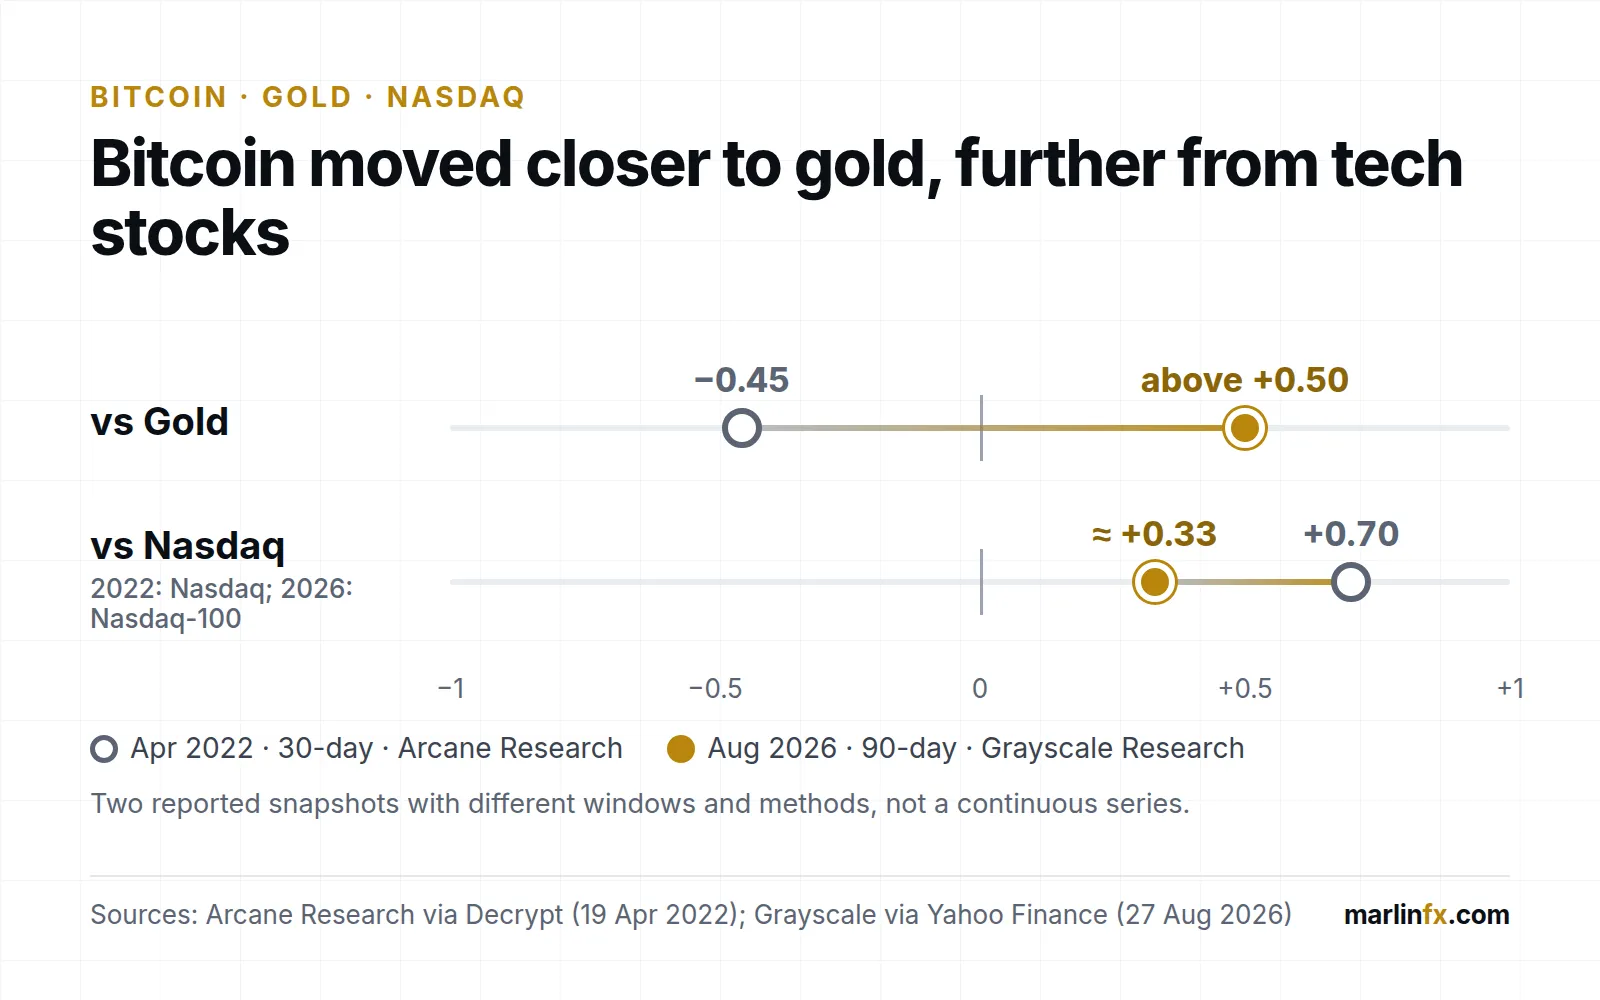
Two reported snapshots, four years apart. Different windows and methods.
Grayscale also notes that over the long run, since 2010, the bitcoin–gold correlation has been close to zero. The 2026 reading is unusual, not the norm.
Why might bitcoin and gold move together?
Analysis, as offered by the sources. Grayscale ties the shift to fiscal worries: larger debt balances, persistent deficits and higher long-term yields have renewed demand for assets seen as hedges against weaker fiscal and monetary fundamentals.
Gold shows a similar pattern in 2026. On 22 September, Saxo Bank’s Ole Hansen pointed out that gold ETF holdings were rising while US 10-year real yields were near 20-year highs. That breaks the usual inverse link we explain in gold and real yields. He attributed it to concern about fiscal sustainability.
Not everyone expects it to last. Glassnode, quoted by The Block, said that sudden decorrelations from equities during sovereign bond selloffs have historically been short-lived. In the past they marked local exhaustion rather than a structural shift.
What a 0.5 correlation does and does not mean
- It is moderate, not strong. Squaring the correlation gives the share of variation the two have in common: 0.5 × 0.5 = 0.25. About a quarter of the day-to-day movement is shared; three quarters is not.
- It says nothing about size. Bitcoin can move several times more than gold on the same day, so a positive correlation does not make one a replacement for the other.
- It is backward-looking. A 90-day window describes the last three months. It can change sign quickly, as it did between 2022 and 2026.
- Windows are not comparable. A 30-day and a 90-day reading from different providers should not be joined into one trend line.
Check it yourself on TradingView
TradingView’s built-in Correlation Coefficient indicator compares closing prices over 20 bars by default. Two assets that both trended upwards can show a high correlation on price levels even when their daily moves are unrelated. That is the same trap we flag for gold and real yields.
A more reliable check correlates daily returns. This short Pine Script does that (Marlin’s own code, free to use):
//@version=6
indicator("Return correlation (Marlin)", precision = 2)
other = input.symbol("BITSTAMP:BTCUSD", "Compare with")
len = input.int(90, "Length (bars)", minval = 10)
r1 = math.log(close / close[1])
otherClose = request.security(other, timeframe.period, close)
r2 = math.log(otherClose / otherClose[1])
plot(ta.correlation(r1, r2, len), "Correlation of daily returns", color.orange)
hline(0, "Zero")
hline(0.5, "+0.5", linestyle = hline.style_dotted)
hline(-0.5, "-0.5", linestyle = hline.style_dotted)
- Open a daily XAU/USD chart. Starting from gold matters: gold does not trade at weekends, so Monday’s bitcoin return then covers Friday to Monday and the two series stay aligned.
- Open the Pine Editor, paste the script and add it to the chart.
- Change Compare with to test other pairs, for example a Nasdaq-100 symbol or the dollar index. Symbol names depend on your data feed: VERIFY CURRENT DATA.
- Write down the date and window of any reading you rely on.
Your result will not match the figures above exactly, because providers use different price sources, windows and closing times.
What it means for gold traders
Analysis. For a gold trader, bitcoin is a cross-check on sentiment, not a signal:
- Both rising on fiscal news (debt, deficits, Treasury supply) supports the view that the move is about the credibility of money, not only rates.
- Gold rising while bitcoin falls points to classic risk-off or central-bank demand rather than a debasement trade.
- The first checks are still gold’s usual drivers: the dollar (gold vs DXY), real yields and the economic calendar. Our pre-session gold routine puts them in order.
Our view
Opinion. The 2026 shift is real in the reported data and worth watching, because it lines up with gold decoupling from real yields for a similar, fiscal, reason. A three-month correlation of about 0.5 is not enough to treat bitcoin as “digital gold”, especially when the long-run figure is near zero and the 2022 reading was the opposite. We will treat it as a regime to monitor, not a relationship to trade.
This is educational analysis, not personal advice. Crypto assets and leveraged products carry a high risk of loss, and crypto CFDs are not available to retail clients in some countries, including the UK.
How this was prepared
Checked 27 Sep 2026
Correlation figures are reported by the named research firms and publications, with dates and window lengths as stated by them. We did not recalculate them from raw prices: the gold, bitcoin and index price series are licensed by their owners, and our data policy only allows us to republish charts from public-domain data. The returns-based script and the reading of the figures are Marlin analysis. Market data changes daily: VERIFY CURRENT DATA before relying on any figure. Facts are separated from analysis and opinion; anything that could not be verified against a current source is marked VERIFY CURRENT DATA. Read the full methodology and editorial policy.
Sources (6)
ShowHide
Official or primary sources used for the facts above. Figures and terms change, so check the source before acting on them.
- Yahoo Finance (reporting a Grayscale Research note) — Bitcoin's 90-day correlation with gold tops 50%, study says debt fears are driving it27 August 2026. 90-day bitcoin–gold correlation above 50%, up from near zero at the start of 2026; bitcoin–Nasdaq-100 down from above 60% to about 33%; long-run correlation since 2010 close to zero.Accessed
- The Block — Bitcoin-gold correlation hits six-year high, but analysts question whether equity decoupling will last3 September 2026. Bitwise data: 90-day correlation near a six-year high; negative 90-day correlation with the dollar index; Glassnode caveat that such decorrelations have tended to be short-lived.Accessed
- Investing.com — Bitcoin's Biggest Regime Shift Yet: From Fed Beta to Treasury Hedge (Charles-Henry Monchau)26 September 2026. Contributor analysis: 90-day correlation with gold about +0.50; with the Nasdaq about 0.30, a one-year low.Accessed
- Decrypt (reporting Arcane Research) — Bitcoin Is Trading Like a Tech Stock, Not 'Digital Gold'19 April 2022. 30-day correlation with the Nasdaq 0.70, highest since July 2020; with gold -0.45, an all-time low.Accessed
- Kitco News — ETF flows show gold price decoupled from real yields as fiscal concerns now drive investor demand – Saxo Bank's Hansen22 September 2026. Gold ETF holdings rising while US 10-year real yields were near 20-year highs.Accessed
- TradingView — Correlation Coefficient (CC)Built-in indicator: default length 20, default source closing price.Accessed
Frequently asked questions
Is bitcoin correlated with gold?
At times. Grayscale reported a 90-day correlation above 0.5 in late August 2026, and Bitwise data cited by The Block put it near a six-year high. In April 2022 Arcane Research reported -0.45 over 30 days, and Grayscale notes that the long-run correlation since 2010 is close to zero. The relationship changes with the macro backdrop.
Is bitcoin the new digital gold?
The 2026 data show bitcoin trading more like gold than it did in 2022, but a correlation near 0.5 is moderate, recent and backward-looking. Bitcoin is also far more volatile than gold. Whether the shift lasts is an open question; Glassnode has noted that similar decorrelations from equities were short-lived in the past.
Why did bitcoin's correlation with the Nasdaq fall?
Grayscale links the shift to concern about US debt and deficits, which has pushed some investors towards assets seen as outside the traditional financial system. That is an explanation offered by a research firm, not a proven cause.
How do I calculate the bitcoin–gold correlation on TradingView?
The built-in Correlation Coefficient indicator compares closing prices over 20 bars by default. For a more reliable reading, correlate daily returns instead: open a daily XAU/USD chart, add a short Pine Script that correlates the log returns of gold and bitcoin over 90 bars, and note the date and window you used.
Can I hedge gold with bitcoin?
Marlin does not give personal advice. A correlation of about 0.5 means the two share only around a quarter of their day-to-day variation, and bitcoin's moves are much larger, so it would not offset a gold position one-for-one. Crypto products are also restricted for retail clients in some countries, including crypto CFDs in the UK.
AdRun the correlation check on TradingView
Paste the script above into the Pine Editor on a daily XAU/USD chart. Compare the free and paid plans on TradingView's site before choosing one.
Explore TradingViewDisclosure: Some links on this website are affiliate links. If you use them, we may receive compensation at no additional cost to you. This does not determine our editorial analysis, reviews or comparisons.
Written by
Volodymyr KravchenkoIndependent market researcher focused on Forex, Gold, commodities, macroeconomic data and AI-powered financial intelligence.
- Forex, gold and oil market research
- Macroeconomic data analysis
- Search-data and SEO analysis
- Website and data-tool building
Educational research, not personal advice. See our editorial policy and methodology.
This content is provided for educational purposes only and is not investment advice. Trading involves risk, and past performance does not guarantee future results. Affiliate relationships may exist. Always conduct your own independent research before making financial decisions.
Related articles

Trading Gold with FxPro: Symbols, Hours, Costs and Sizing (2026)
How gold trading works at FxPro: GOLD, GOLDoz and weekend GOLD365, contract sizes, UTC hours, spread, commission and swap, with worked sizing examples.
Read analysis
Gold vs DXY: Why the Dollar Often Moves Against Gold
Why gold and the US Dollar Index often move in opposite directions, what DXY really measures, when the link breaks and how to test it yourself.
Read analysis
Gold and Real Yields: Why Opportunity Cost Matters
Why rising real yields have often pressured gold, what a real yield is, why the link is unstable, and how to test it yourself with official data.
Read analysis